DraftKings

Friday, April 18, 2014

How the Wings Can Beat the Bruins: A Look at 6 Key Bruins Losses

How the Wings Can Beat the Bruins: A Look at 6 Key Bruins Losses


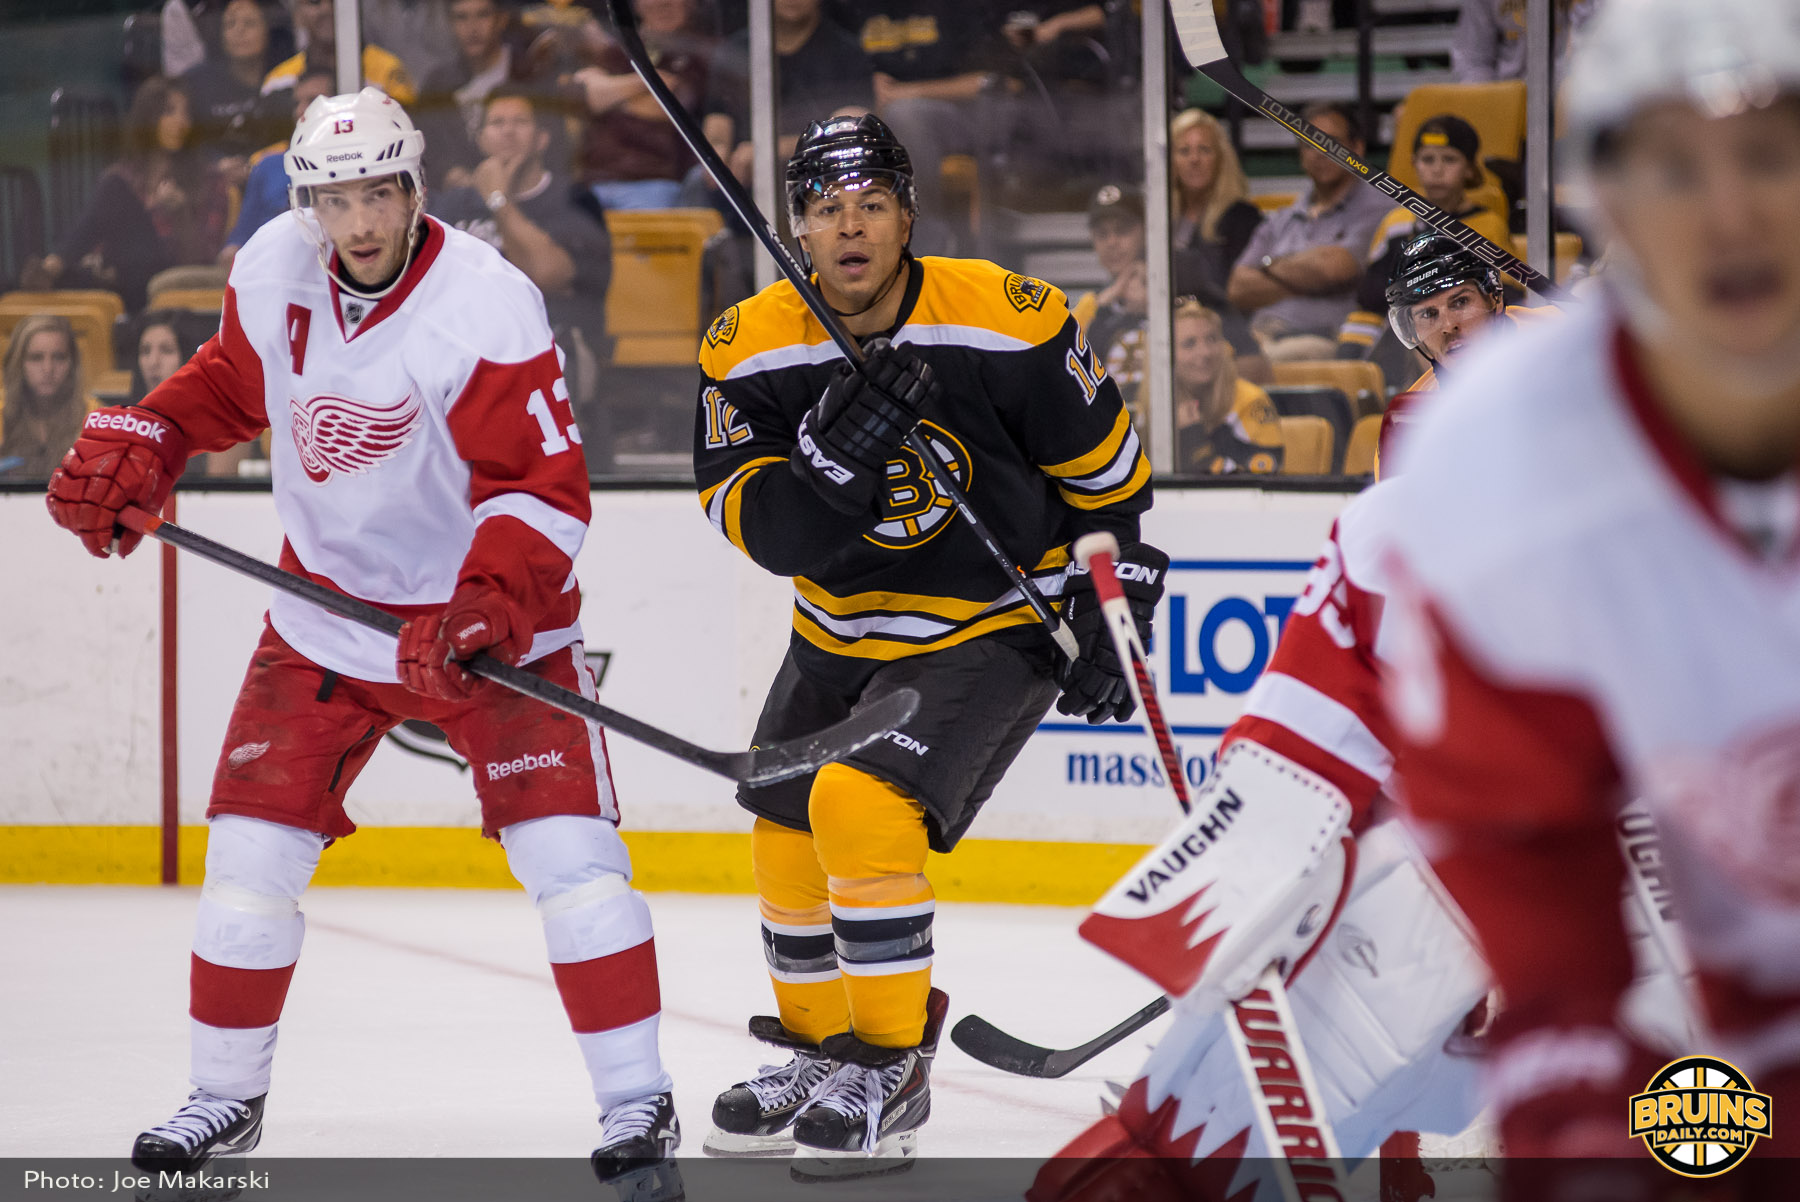
Well, boys, you hustled hard out there, and it all paid off! Members of the Detroit Griffins, managed to earn a spot in the playoffs and keep one of the proudest streaks in professional sports alive. Way to go!! Now, now, before you get too excited, here comes the fun part--you get to play Boston!! What? Where are you going? Quit hiding behind Zetterberg's beard. There's still a chance yet! In fact, they had 6 non-shootout losses from January through March this year. And you only have to beat them four times! This time of year is when rivalries are forged and heroes are made. Here's the blueprint for success against the Bruins.


The Battle of Penalties Must Be Won

In half of Boston’s 6 losses, the winning team took fewer penalties. Of the remaining 3, the penalties were even. Only one team managed to win while losing the penalty battle, the St. Louis Blues. Let the Blues be the outlier. Get the B-Men off their game and in the box early and often.

Win the Faceoff Battle As Well

            4 of 6 teams that beat Boston also won the majority of their faceoffs, which is nothing to sneeze at considering Bergeron's impressive 58.6% win rate while leading the league in faceoff wins. Having Pavel Datsyuk back in the lineup should help in that regard, but Legwand, Sheahan, Helm, and Glendening will have to step up their faceoff games if the Wings are looking to put their best chance forward.
  

Shut Down Krejci-Lucic-Iginla Line

4 of 5 teams contained them to 6 or fewer shots, below their average for the year. Lucic was out against Anaheim, Krejci-Iginla held to 3 shots total. Scored 55 on ice together, 77 total. Nearly 1/3 of teams total goal production. Only two goals in 6 losses overall. Assisted on two others (4pts in 6). Bottom line--these a**holes need to calm down! Stick Glendening on Krejci all night and see what happens. Good things, my friends. Good things.

Keep Jimmy on His Game

            In 4 of 6 Boston losses, opposing goalies saved shots at or above league average. What's more, in all 6 Boston losses the winning team's starting goalie had a higher save percentage. This isn't too surprising, considering the Bruins typically outshoot their opponents, 

Rattle Tuukka Rask


            In all 6 losses, Tuukka saved below league average. Heck, in most of these losses, Tuukka was downright awful, being relieved by Chad Johnson twice. If there's one thing the Wings can do to win, it's to take a quality-over-quantity approach to Oh, speaking of Chad, he's been pretty great in Tuukka's place, hasn't he? Fear not, for he too has proven his mortality, losing his start against Buffalo back in February. Buffalo! Let's face it--if Buffalo can beat these guys, anyone can.

But will they? Well, that's a different beast entirely. With Zetterberg ruled out for the first two games, the Wings will have to depend on some good old fashioned puck luck to challenge the black and gold. Oh, by the way, welcome to the Eastern Conference!

Stanley Cup Day 2 Recap -- 2 OT Thrillers? Boy, Oh Boy!

Well, well, well. Ask and ye shall receive, as they say. Tonight, we were treated to two more overtime thrillers, which is no great surprise considering the match up presented, no, treated to us this evening.

The biggest billing of the evening, Blues vs. Blackhawks, gave us the first triple OT game of the playoffs and, as it often goes in triple OT games, the game was settled on a crucial misplaying of the puck. Im this case, it was the Blackhawks defense allowing a streaking Alex Steen to rip a point-blank shot on a helpless Corey Crawford. It was a hard luck loss for Blackhawks, you can't expect to win games when getting outshot by double-digits in the Stanley Cup playoffs. Major credit should be given to Crawford for keeping the Hawks in the game, but it was ultimately fruitless. Blues up 1-0, without Oshie or Berglund. I suppose the beauty of the 7 game series is that one game won't necessarily crucify a team, but you know the Hawks are kicking themselves after letting that one slip away from them, especially after Lapierre blocked a game-ending goal in OT. Can't wait for game 2, as this first round series has the potential to be one of the all-time greats.

The second, and arguably more exciting OT thriller between the Avs and the Wild proved that taking down Minnesota would be no cakewalk for Colorado. Heck, it took a skin-of-their-teeth comeback effort from Stastny, MacKinnon and Co. to reach overtime. The Avalanche's defense (or lack thereof) may prove to be their undoing. Similarly, Minnesota is going to have to a better job of holding onto the puck if they're planning on going anywhere in the playoffs.

We also saw a tough battle between the Rangers and Flyers, where Ray Emery hung tough for most of the game against the Rangers offensive onslaught. Unfortunately, the Flyers game absolutely imploded in the 3rd, allowing two goals within a minute and only recording one shot on goal in the period. It was a truly pitiful effort, but this comes as no surprise considering the Flyers' play at Madison Square Garden this year. Considering the Rangers have home-ice advantage in the series, the Flyers know they'll have to steal a game on the road to win the series. Expect them to bounce back in Game 2 and play a much closer game, especially if Mason is in net. While Emery did play much better than I expected, having your best goaltender in net gives the entire team more confidence to make aggressive plays, something that Philly will need to do to beat Henrik Lundqvist.

Lastly, and surely least interesting was the Sharks annihilation of the Kings. Snoozefest. Sure, the Sharks's goals were nice (always good to see that Hertl kid do his thing), but the game was never close. Perhaps we were spoiled by the other 6 games (Rangers-Flyers wasn't much better), but the product the Kings trotted out last night was pathetic.

Standouts from Tonight's Games


3 Point Efforts:
Paul Stastny (COL)
2G, 1A
Nathan MacKinnon (COL)
3A
Brad Richards (NYR)
1G, 2A

2 Point Efforts:
Brent Seabrook (CHI)
1G, 1A
Ryan O'Reilly (COL)
1G, 1A
Jamie McGinn (COL)
1G, 1A
Marc-Edouard Vlasic (SJ)
1G, 1A
Tomas Hertl (SJ)
1G, 1A
Brent Burns (SJ)
1G, 1A
Martin St Louis (NYR)
2A
Jonathan Toews (CHI) 
2A
Zach Parise (MIN)
2A
Tyson Barrie (COL)
2A
James Sheppard (SJ)
2A

Plays of the Night


And that's a wrap! Thanks for stopping by. Oh, and go Wings!

Peace,
Jay Willy

Thursday, April 17, 2014

Stanley Cup Playoffs -- Preview of Day 2

Well, the first day was pretty great. But you're telling me we get 4 games tonight? Hot damn, now that's what I like to hear! Now what's a guy gotta do to get a couple more OT thrillers on the line? I'd sell my soul (gently used), but I'm pretty sure it's not worth much after being repeatedly crushed by the Detroit Lions every year(I'm not bitter, honest. Don't let them see you cry). Ok, in all fairness the Lions have made some good moves in the offseason, and are looking poised to compete for a wildcard berth at very least, but that's neither here nor there. But enough about the miserable Lions, here's some fun facts about tonights Stanley Cup Playoff match ups.

Philadelphia Flyers vs. New York Rangers

Last 7 Games: Philly (3-3-1) Rangers (4-1-2)
Notable Injuries: NYR Chris Kreider (LW), PHI Steve Mason (G), PHI Steve Downie (RW)


Looks like we got lucky with another first round gem. One of the most brutal rivalries in the NHL today is about to get nastier. It's no secret that the Flyers and Rangers hate each other, especially when you look at the total PIMs for the four games they've played this year (55 + 78 + 38 + 20 = 191), it'd be a big shock if this series isn't chippy from the get-go.

On the season, it's of somewhat interest that the home team has won each game. It's also important to note that the Rangers have absolutely dominated at home, while the games have been somewhat close in Philly, and this is with a healthy Steve Mason between the pipes. While the likes of Giroux, Simmonds, Voracek and Hartnell give the Flyers some chance to pull off the upset, the absence of Mason really hurts their chances tonight.

SIGNIFICANT EDGE: RANGERS

DUE TO DELAYS, I WILL NOT BE POSTING A FULL WRITE-UP. HERE'S MY QUICK BREAKDOWN OF THE REMAINING MATCHES

Chicago Blackhawks vs. St. Louis Blues

BLACKHAWKS : HEALTHY
BLUES : BANGED-UP
GOALIES : MEDIOCRE
BLACKHAWKS : EDGE
GOALS  :  APLENTY
FORMER  :  CHAMPS

EDGE: HAWKS

Minnesota Wild vs. Colorado Avalanche

AVS  :  SO HOT
VARLY  :  SO HOT
MIKKO  :  EN FUEGO
DEFENSE  :  
DUCHENE  :  INJURED
MACKINNON :  MACKILLIN' IT
BRYZGALOV  :  UNIVERSE
REGRESSION  :  TO MEAN

EDGE: AVS

LA Kings vs. San Jose Sharks

NIEMI  :  STILL SLACKIN
QUICK  :  SO CLUTCH
VLASIC  :  PICKLES
DOUGHTY  :  CANNON
NINJA  :  HERTL
GABORIK  : SO SLICK
COUTURE  :  THE FUTURE
KOPITAR  :  GREAT SO FAR
THORNTON  : STROKIN IT
CARTER  :  DANGLIN
PAVELSKI  :  SNIPIN
BURNS  :  BEARDIN
RUNNING OUT OF :  IDEAS
10PM  : START TIME
SLEEP SCHEDULE  :  REKT

MICRO EDGE: SHARKS

Stanley Cup Playoffs -- Day 1 Recap (The Heat is On)

Oh my goodness, ladies and gents! What a great day in hockey!

We had our first OT thriller with Montreal finally getting the winning shot past Anders Lindback, who was put to work all night. Props to the Canadiens for outshooting the Bolts 44-25, but Tampa Bay will have to keep the shot total closer if they want to have a chance in this series.

And, hello, Columbus! Though the final score was no surprise, the Jackets came out firing on all cylinders and managed to outshoot Pittsburg, even! Mark Letestu continues his red-hot scoring streak, with 6 points in his last 6 games, 5 of them being goals. Pretty great for a guy who went undrafted.

For those unfamiliar, Mark played 3 years of juniors and 1 year for Western Michigan in his college years before being signed by a pro club. You might be wondering who took a stab at this fresh-faced Bronco. If you guessed Columbus, you'd be 100% wrong! It was none other than the Pittsburg Penguins, who traded him to Columbus for a fourth round pick in 2011, and now may be a difference maker in this series. Though with that fourth round selection, the Penguins acquired Matia Marcantouni, a consensus top 10 pick known for his blistering speed and physical style, who fell to the 4th round due to a shoulder injury he suffered before the draft. While Matia hasn't cracked the club's AHL roster, the kid's only 20 and could very well become a force once he develops his game further.

Other surprises from that tilt: Marc-Andre outplayed Bobrovsky? Poor Bob. Can't catch a break, much like his entire franchise. Both Sid and Malkin looked great out there. Niskanen continues a hot streak of his own, with 6 points in his last 4 games. Jack Johnson now has 4 points in his last 3 games. James Neal has a quiet night by his standards: no goals, no assists, 2 shots on goal, no dirty hits. Stick to the scoring, James. It's what the fans want! (Well, at least this one.) Beau Bennet, Jussi Jokinen and Brandon Sutter each had a goal, which means good things for the Pens. Whenever you're getting quality production outside of your star players, it bodes well for a deep cup run. You heard it here, first, everyone! I just jinxed the Pens! (Do you hear that? That's the sound of Wings fans rejoicing across the globe).

For the last game of the evening, we got to feel each Ducks fan  (There are dozens of them! Dozens!) have a minor heart attack after Ryan Getzlaf took a slapshot to the face. Thankfully, the xray indiciated no structural damage, and Getz will be back for game 2. But before all that took place, we saw the Ducks absolutely steamroll the Stars. Well, at least for the first 30 minutes. For those who've followed the Stars all year, they tend to play their best hockey in the second half of the tilt, and this game was no exception. After digging themselves a 4 goal grave, the Stars battled back and scored 2 at the end of the 2nd period, and brought the deficit to 1 in the 3rd. Despite the Stars' impressive rally, they ended up with the L. Now imagine what would happen if the Stars played a full 60 minutes? In situations such as these, I tend to put blame on the coach, albeit somewhat unfairly. Perhaps the Stars lack of veteran leadership is to blame. Tough to speculate. What's certain is that when the Stars are on, they're a dominant team.

Big surprises: Kari "Stonewall" Lehtonen allowed two goals on the first five shots. Colton Sceviour potted a goal and an assist. Corey Perry was held to an assist. Beleskey got 1G, 1A. Trevor Daley continued his hot streak with an assist, bringing him to 6pts in his last 5 games. Jamie Benn and Tyler Seguin continued to produce the bulk of the offense with a goal each. Beauchemin had two helpers bringing his total to 4 in his last three games.

Thanks for reading! If you liked what you see, tell your friends! Or maybe just tell Mama Willy so she doesn't feel like I'm wasting my life.

Peace,
Jay Willy

Wednesday, April 16, 2014

Come One, Come All! The Stanley Cup Playoffs Are Here!

Everybody, it's official. The most exciting playoffs in all professional sports kickoff tonight (even ESPN agrees!). For those of you who haven't been able to keep up with the story lines or latest trends of the NHL, fear not! We've got you covered. Here's all you need to know about tonights matchups.

Montreal Canadiens vs. Tampa Bay Lightning

Last 7: Canadiens (4-2-1)  Lightning (5-2-0)
Notable Injuries: TB Ben Bishop (G)

The Bolts showcase their patent-pending, multi-layered "onion" defense


As is pretty much always the case in hockey, each team's goaltending is the main topic of conversation for this series. With breakout goaltender Ben Bishop, a likely Vezina finalist, sidelined with an upper-body injury, the Bolts enter the series lacking one of their best players. The Lightning will be counting on Anders Lindback to fill that gap. The good news for Lighting fans? Lindback has been sensational so far, winning all 3 of his starts and allowing only two goals in that stretch, and back-up back-up Kristers Gudlevskis stood on his head in his start, saving 36 of 38. Personally, I'm excited to see if they'll be able to keep it up when the pressure's on, as neither goaltender has started a playoff game in their career.
On the opposite end of the spectrum, we have the white-hot Canadiens looking to ride goaltender Carey Price to victory, as he's had a sensational year in his own right. While the Canadiens seem to have put their scoring woes behind them with surging Max Paccioretty and the acquisition of Thomas Vanek, averaging 2.8 goals per game over their last 10, it remains to be seen whether the Habs can keep it up the pace.

Scoring goals has seldom been a problem for the Lightning, but the  . While you can never discount a team with a healthy Steven Stamkos, Valteri Filpulla and rookie sensation Ondrej Palat on the roster, the lack of goaltending experience will likely be the Bolts' undoing in this series. Oh, did I mention the Canadiens still have last year's Norris winner P.K. Subban? While it's close, the absence of Ben Bishop between the pipes for the Lightning makes this an easy choice.

EDGE - CANADIENS

Columbus Blue Jackets vs. Pittsburgh Penguins

Last 7: Blue Jackets (5-2-0)  Penguins (3-2-2)
Notable Injuries: PIT Evgeni Malkin (C), CLS Nick Foligno (C), Nathan Horton (C)

Geno is back and ready for action!


Here we have a proverbially David vs. Goliath, featuring a perennial basement dweller up against a start-studded perennial favorite. In case you missed it, the Penguins have suffered numerous injuries and suspensions throughout the season, including Kris Letang's stroke and James Neal's multiple dirty play suspensions. Yet, in spite all of this, the Penguins have managed to win their division. Imagine that. The reason for that is a secret to no one, as the Penguins not only have a great supply of talent at the top, they've had great play from their lesser known players, such as Olli Maata, Matt Niskanen, and Jussi Jokinen. The good news for Pens fans is that their team is entirely healthy at exactly the right time, which is pretty terrible news for the Blue Jackets. Despite Columbus's respectable play down the stretch, they will need goaltender Sergei Bobrovsky, last year's Vezina winner, to play exceptionally well, as they are simply outgunned.

The Blue Jackets aren't completely without an offensive star, with 21 year-old star Ryan Johansen producing at a point-per-game pace, buoying up the production of Boone Jenner and Mark Letetsu. And they have a freaking cannon in their arena! How cool is that? While I'd typically go with the team with the better goaltender (Sorry Marc-Andre Fleury, 2009 was a long time ago), a healthy Pens squad is too strong a force for the Jackets. Can these guys ever catch a break?

BIG EDGE - PENGUINS

Dallas Stars vs. Anaheim Ducks

Last 7: Stars (5-2-0)  Ducks (3-2-2)
Notable Injuries: DAL Rich Peverley (C)

Can the Ducks win another one for the Finnish Flash?

This could quite easily be the closest, most exciting matchup of the first round. With Ryan Getzlaf and Corey Perry clashing with Jamie Benn and Tyler Seguin going head to head, what's not to love?Apparently, not too much, as it's been rated the matchup fans are least excited to watch (well, at least according to /r/hockey). Granted, there are some heavyweight matchups in the first round, this one should delight as well. But I digress, on to the breakdown!

The goaltender quality in this matchup is pretty exciting. Kari Lehtonen for the Stars has been excellent this year, while Anderson starts first for Anaheim, as Hiller has struggled of late. Andersen has been very good when called upon, but is unproven. 

I should also mention the Stars have a cause around which to rally their forces, the traumatic cardiac event of teammate Rich Peverley. The emotional aspect of sports is never to be underestimated. While the Ducks are quite possibly the most consistent team in league, and would love to win a cup for Teemu Selanne in his last Stanley Cup run, I like the Stars chances to give the Ducks a run here. Goaltending trumps all.

SLIGHT EDGE - STARS

Well, there you have it folks. For those curious as to what Vegas thinks about tonight's games, as of this writing they have Tampa Bay (-125) with a slight edge over Montreal (+105), Pittsburgh (-200) as a huge favorite over Columbus (+170) , and Anaheim (-155) significantly favored over Dallas (+140).

For those into daily fantasy, I'd take Fleury as your goaltender, and all Dallas players, peppering in Montreal players where they fit.

Thanks for reading and let's hope for some great hockey tonight!

-Jay Willy

Tuesday, December 17, 2013

ESPN Fantasy Hockey Rotisserie League Stats Breakdown - NHL Average Stats

With another day in the books comes another article in Fantasy Hockey matchup quality. Today we're going to take a look at the league averages in stats allowed for each category and how each team stacks up. Below you'll find the averages for all NHL Teams so far this year through yesterday's games:


Scoring+/-PIMPPSOGATOI-PPATOI-PKWSV%GAA
NHL Average2.64011.410.629.955:325:320.500.9122.542
Standard Dev0.390.511.920.142.740:350:280.1300.0110.401

Looking at theses numbers gives you an idea of how matchup-dependent each stat category is, as the the larger the standard deviation is compared to the average, the more the category varies based on the opposing team. As you might expect, Goalie Wins and +/- vary considerably based on match-up, as a strong opponent does a much better job of outscoring their opponents than a weak opponent. Another stat that varied substantially was Power Play Points, which makes sense as some teams couldn't kill a penalty to save their lives! (See New Jersey Devils, Florida Panthers).

On the other end of the spectrum, you'll see that a goalie's save percentage doesn't vary much from opponent to opponent. However, in a league where a 92% save percentage is mediocre and 93% is pretty good, there's a slim margin at that stat. Similarly, Power Play Time On-Ice and Penalty Kill Time On-Ice stay pretty consistent, with the Penalty Kill Time being the most matchup-proof of these groups, league wide.

So, what's does it all mean? As a general rule, for +/-, Power Play Points, Wins and, heck, for all goalie stats the opposing team matters tremendously. Penalty Kill players tend to be the most consistent with ATOI, while PIM, ATOIPP and SOG vary somewhere in the middle.

So now that we know what's typical for the NHL, here's a look at what teams have been averaging so far this year, keeping in mind, these are the stats for teams against the teams listed. For example, teams are averaging 2.43 goals per game against Anaheim.

Teams Stats Against Goalie Stats
TEAM Scoring +/- PIM PPP SOG ATOIPP ATOIPK W GAA SV%
Anaheim 2.43 -27 11.86 0.63 28.8 5:23 5:33 0.34 3.03 0.903
Boston 2.06 -22 10.06 0.45 28.9 5:20 4:24 0.33 2.58 0.907
Buffalo 2.91 37 11.61 0.64 34.2 5:32 5:17 0.79 1.48 0.941
Calgary 3.15 17 9.85 0.62 29.6 5:11 5:40 0.61 2.55 0.907
Carolina 2.68 7 9.24 0.62 30.8 5:25 5:13 0.59 2.18 0.921
Chicago 2.72 -32 9.97 0.55 27.3 5:26 5:20 0.33 3.53 0.891
Colorado 2.31 -20 9.84 0.78 31.3 4:32 5:13 0.31 2.72 0.904
Columbus 2.76 8 11.44 0.59 30.3 5:29 4:54 0.59 2.41 0.908
Dallas 3 -5 12.38 0.66 32.8 5:03 6:13 0.53 2.69 0.913
Detroit 2.51 1 8.49 0.57 29.1 6:12 5:36 0.57 2.46 0.915
Edmonton 3.4 29 11.86 0.63 30.9 5:28 6:08 0.69 2.49 0.908
Florida 3.09 16 12.53 0.79 29.1 4:51 5:54 0.65 2.15 0.926
Los Angeles 1.94 -22 12.24 0.56 27.4 6:39 6:03 0.35 2.50 0.914
Minnesota 2.2 -3 10.09 0.71 26.2 5:32 5:14 0.46 2.09 0.920
Montreal 2.06 -3 11.83 0.43 30.1 5:40 5:39 0.43 2.37 0.915
Nashville 2.7 16 10.03 0.48 30.1 5:34 5:05 0.52 2.24 0.918
New Jersey 2.35 5 7.15 0.41 24.5 5:35 5:01 0.62 2.24 0.910
NY Islanders 3.41 24 10.56 0.88 30.3 4:53 5:31 0.74 2.32 0.922
NY Rangers 2.68 21 11.62 0.44 28.9 4:50 5:24 0.53 2.15 0.928
Ottawa 3.09 4 12.29 0.86 34.1 6:27 6:05 0.60 2.69 0.916
Philadelphia 2.67 11 15.97 0.70 30.4 7:02 6:22 0.58 2.12 0.922
Phoenix 3.06 -4 10.44 0.78 33.4 5:36 5:15 0.44 2.97 0.902
Pittsburgh 2.14 -10 11.31 0.37 26.9 5:00 5:11 0.31 2.89 0.902
San Jose 2.33 -18 11.88 0.48 27.5 4:22 6:42 0.39 3.03 0.913
St. Louis 2.34 -26 16.13 0.56 25.7 5:58 5:32 0.31 3.28 0.886
Tampa Bay 2.39 -7 11.48 0.55 29.2 6:02 5:55 0.42 2.48 0.907
Toronto 2.86 0 14.49 0.86 36.2 6:16 5:27 0.51 2.60 0.901
Vancouver 2.29 -10 11.77 0.31 28.3 5:17 4:58 0.43 2.71 0.915
Washington 2.85 8 14.85 0.60 35.1 5:33 5:43 0.45 2.94 0.903
Winnipeg 2.8 5 9.43 0.61 31.1 6:05 5:38 0.57 2.40 0.921

As you can see, teams like Anaheim, Chicago and Vancouver have been stingy in multiple areas, while Ottawa, Philadelphia, Buffalo and the New York Islanders have been quite generous. One thing that I noticed is that teams that are great for Skaters tend to be bad for goaltenders and vice versa.

I'll save you the trouble of searching for the best and worst matchups:

PLAYER STATS BEST/WORST
Goals/Assists: Best - NY Islanders. Worst - LA Kings.
Plus/Minus: Best - Buffalo Sabres. Worst - Chicago Blackhawks.
Penalty Minutes: Best -  St. Louis Blues. Worst - New Jersey Devils.
Power Play Points: Best -  NY Islanders. Worst - Vancouver Canucks.
Average Time On Ice Power-Play: Best -  Philadelphia Flyers. Worst - San Jose Sharks.
Average Time On Ice Penalty Kill: Best - San Jose Sharks. Worst - Boston Bruins.

GOALIE STATS BEST/WORST
Goalie Wins: Best -  Buffalo Sabres. 3 Tied for Worst - STL, PIT and COL.
Goals Against Average: Best - Buffalo Sabres. Worst - Chicago Blackhawks.
Save Percentage: Best - Buffalo Sabres. Worst - St. Louis Blues.

So there you have it folks. For the next PuckNumbers post, we'll be taking a look at which teams have been the best to play against objectively, with a follow-up post on which goalies have been fantasy gold for their opponents.

Monday, December 16, 2013

It's All About the Matchup - Full Fantasy Hockey Team Matchup Rankings for ESPN Roto Leagues 2013

Welcome to Puck Numbers!

As a life-long hockey fan, I've decided to try my hand at fantasy hockey this year and have been loving every minute of it. Having played fantasy football, I was surprised to see a lack of quality match-up statistical analyses, as in any sport the quality of a player's opponent is often as important as the quality of the player himself. Curious, I took the plunge into the statistical void and have returned with some great data! I'll be updating this data daily with short and long-term breakdowns to identify which teams are winning and which are losing.

The inaugural post here is a full-breakdown of each NHL team and how generous or stingy they've been in each statistical category. To start, I've broken down the numbers for the ESPN Standard Roto stat categories, which consists of Goals, Assists, Plus/Minus, Penalties in Minutes, Power Play Points, Average Time On Ice, and Shots on Goal. I've also completed a breakdown of the goalie statistics: Wins, Save Percentage and Goals Against Average.

To keep things as straightforward as possible, I've done a simple recording of the total stats so far without getting into advanced statistics, which have been proven to be more predictive. More on that analysis in future posts.

Now, on to the data! Before you look, I'll explain how each column was tabulated.

Most of these stats were mined directly from NHL.com. However, some were less straightforward. You'll notice the Average Time on Ice is split into two categories: PP and PK. The PP column is a measurement of the amount of time the opposing team spent on the power-play compared to the average team. For the Penalty Kill, I investigated how much time opposing teams spent a man or more down compared to the average. 

One of the more difficult stats to tabulate was opposing goaltender GAA, which I calculated by subtracting each team's Total Empty Net Goals by their Total Goals For, then dividing by total games played to better approximate the data. Ok, for real this time, on to the data!


NORMALIZED TEAM MATCHUP DATA

TEAMGA+/-PIMPPSOGATOI-PPATOI-PKWSV%GAA
ANA-0.21-0.21-0.770.470.02-1.145:235:33-0.1565-0.00940.4859
BOS-0.58-0.58-0.67-1.32-0.15-1.045:204:24-0.166-0.00450.0331
BUF0.270.271.120.220.034.265:325:170.28850.0291-1.0578
CGY0.510.510.52-1.530.01-0.345:115:400.1067-0.00530.0028
CAR0.040.040.21-2.1500.865:245:180.08890.0088-0.3662
CHI0.080.08-0.89-1.41-0.06-2.645:265:20-0.166-0.02090.9851
COL-0.32-0.32-0.65-1.540.171.364:325:13-0.1768-0.00650.0702
CBS0.120.120.24-0.080.010.365:214:490.0764-0.004-0.1184
DAL0.260.26-0.161.070.072.364:586:060.016800.167
DET-0.13-0.130.03-2.9-0.04-0.846:125:360.07210.0034-0.0855
EDM0.760.760.830.470.020.965:286:080.1864-0.0035-0.057
FLA0.450.450.471.150.19-0.844:515:540.14770.0139-0.3956
LAK-0.7-0.7-0.650.85-0.05-2.546:396:03-0.14640.0024-0.0427
MIN-0.44-0.44-0.09-1.30.11-3.745:325:14-0.04220.0078-0.457
MON-0.58-0.58-0.090.45-0.180.165:405:39-0.07080.0035-0.1712
NSH0.060.060.48-1.35-0.120.165:355:010.01580.006-0.3002
NJD-0.29-0.290.15-4.24-0.2-5.445:345:050.1183-0.0021-0.3074
NYI0.770.770.71-0.820.280.364:535:310.23590.0105-0.2191
NYR0.040.040.620.23-0.17-1.044:505:240.03010.0165-0.3956
OTT0.480.480.120.880.284.166:316:050.11830.00450.1338
PHI0.030.030.334.590.090.467:026:220.07640.0103-0.4215
PHX0.420.42-0.13-0.950.173.465:365:15-0.0619-0.00970.4261
PIT-0.46-0.46-0.29-0.15-0.25-3.044:535:16-0.1758-0.010.3691
SJS-0.31-0.31-0.550.5-0.12-2.444:226:42-0.10540.00090.4876
STL-0.32-0.32-0.844.91-0.03-4.445:575:35-0.209-0.02770.7799
TBL-0.25-0.25-0.210.1-0.06-0.746:025:55-0.0751-0.0045-0.0578
TOR0.210.2102.880.286.466:235:220.0006-0.0130.1044
VAN-0.35-0.35-0.290.39-0.29-1.645:174:58-0.07080.00260.1716
WSH0.210.210.243.470.015.165:395:42-0.0448-0.0090.3967
WPG0.180.180.15-2.2701.366:055:380.08890.0097-0.1603


RANKING BREAKDOWN PER STATISTICAL CATEGORY - SKATERS

TEAMScoring+/-PIMPP ScoringSOGATOI-PPATOI-PK
ANA19281112221915
BOS28272225202130
BUF71151031521
CAR15112716101820
CBS12101715132029
CGY352514162310
CHI13302422261719
COL232526672925
DAL820696244
DET1815291919513
EDM2210119163
FLA575418278
LAK30268202526
MIN2617217281424
MON2918122715911
NJD21133028301326
NSH1462324141227
NYI13193122616
NYR1641426212817
OTT41472435
PHI178281112
PHX61920551123
PIT27231829272522
SJS222492324301
STL242911829814
TBL202116211777
TOR916411418
VAN25221330232228
WPG111228178612
WSH1093132109

RANKING BREAKDOWN PER STATISTICAL CATEGORY - GOALIES

WSV%GAATEAM
252527ANA
262118BOS
111BUF
976CAR
111912CBS
72217CGY
272930CHI
292319COL
141622DAL
121213DET
31815EDM
434FLA
241416LAK
1782MIN
211110MON
5177NJD
1598NSH
249NYI
1325NYR
61021OTT
1053PHI
192626PHX
282724PIT
231528SJS
303029STL
222014TBL
162820TOR
201323VAN
8611WPG
182425WSH

The numbers here show how much below or above average teams have performed against each of these teams. For all stats except GAA, the larger, positive numbers are better. Edmonton and the New York Islanders are each allowing nearly a goal more than the average team and nearly a goal and a half more than the LA Kings, the stingiest team so far for scoring.

No big surprises here, save for Toronto and Washington ranking quite highly as favorable match-ups for skaters.

Take these numbers as a rough guide, as there is much more work to be done. For example, I plan to investigate whether teams allow assists at a near-equal rate, which I'll address in a future post. Addtionally, overtime minutes for goalies should be accounted for when calculating Goals Against Average is calculated by Goals Allowed per 60 on-ice minutes. Despite these shortcomings, this guide should suffice.

For my next post, I'll take a closer look at which teams have been the most generous match-ups across the board. I'll keep ya posted. Until next time, best of luck!

For those interested in the raw numbers, shoot me an e-mail at Jaywillyfantasy@gmail.com

Also, for those who are looking for a break from setting the same players in their line-ups everyday, check out DraftKings.com and enter one of their daily NHL Fantasy Drafts. I've found it especially satisfying whenever I try to pick up a player only to find another team scooped them up. Playing here helps me keep my blog going and the great data flowing for you. See you there!